Infectious disease epidemiology is the study of the incidence and spread of infectious diseases in populations over time. Host, pathogen and environmental factors are monitored to determine the dynamics of infection with an ultimate goal of developing, applying or strengthening control measures to mitigate risk and spread of pathogens.
SARs-CoV-2 Studies
Hendricks, Brian, Bradley S. Price, Timothy Dotson, Wes Kimble, Sherri Davis, Maryam Khodaverdi, Adam Halasz, Gordon S. Smith, and Sally Hodder. "If You Build It, Will They Come? Is Test Site Availability a Root Cause of Geographic Disparities in COVID-19 Testing?." Public Health (2022).
Objectives
The purpose of this study was to examine the relationship between test site availability and testing rate within the context of social determinants of health.
Study Design
A retrospective ecological investigation was conducted using statewide COVID-19 testing data between March 2020 and December 2021.
Methods
Ordinary least squares and geographically weighted regression were used to estimate state and zip code level associations between testing rate and testing sites per capita, adjusting for neighborhood level confounders.
Results
Findings indicate that site availability is positively associated with the zip code level testing rate and that this association is amplified in communities of greater economic
deprivation. Additionally, economic deprivation is a key factor for consideration when examining ethnic differences in testing in medically underserved states.
Conclusion
The study findings could be used to guide delivery of testing facilities in resource-constrained states.
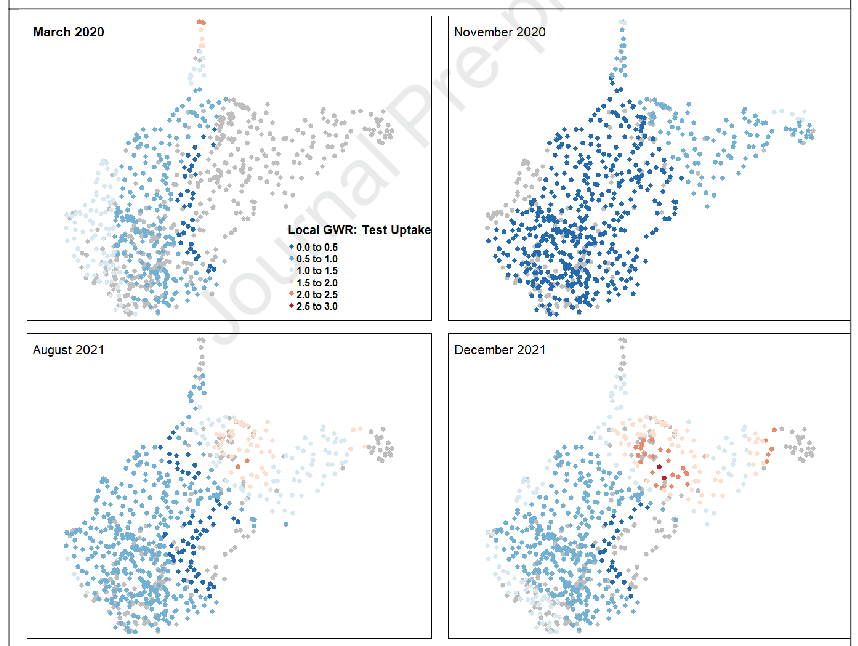
effect of testing sites per 1000 persons on the testing rate by zip code for March 2020,
November 2020, August 2021 and December 2021.
Zip codes with grey dots indicate no statistically significant effect of test sites per 1000
persons on testing rate. Zip codes where test sites per 1000 persons had a statistically
significant local effect are displayed using a blue to red gradient, where lower effects are
indicated in blue and higher effects are in red. It is important to note that any zip code with
blue or red shading did observe a statistically significant positive effect between number of
testing sites and testing rate. The blue to red gradient is used to merely display the extent of
the significant effect over time.
Khodaverdi, Maryam, Bradley S. Price, J. Zachary Porterfield, H. Timothy Bunnell, Michael T. Vest, Alfred Jerrod Anzalone, Jeremy Harper et al. "An ordinal severity scale for COVID-19 retrospective studies using Electronic Health Record data." JAMIA open 5, no. 3 (2022): ooac066.
Although the World Health Organization (WHO) Clinical Progression Scale for COVID-19 is useful in prospective clinical trials, it cannot be effectively used with retrospective Electronic Health Record (EHR) datasets. Modifying the existing WHO Clinical Progression Scale, we developed an ordinal severity scale (OS) and assessed its usefulness in the analyses of COVID-19 patient outcomes using retrospective EHR data.
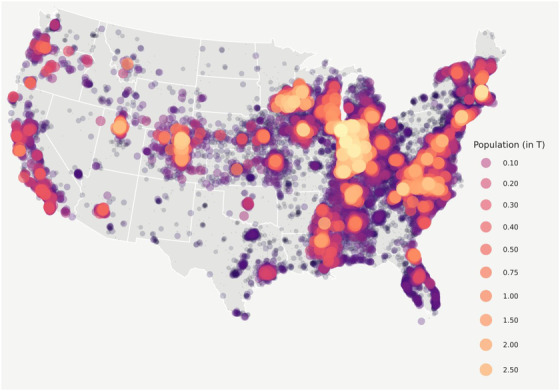
An OS was developed to assign COVID-19 disease severity using the Observational Medical Outcomes Partnership common data model within the National COVID Cohort Collaborative (N3C) data enclave. We then evaluated usefulness of the developed OS using heterogenous EHR data from January 2020 to October 2021 submitted to N3C by 63 healthcare organizations across the United States. Principal component analysis (PCA) was employed to characterize changes in disease severity among patients during the 28-day period following COVID-19 diagnosis.
The data set used in this analysis consists of 2 880 456 patients. PCA of the day-to-day variation in OS levels over the totality of the 28-day period revealed contrasting patterns of variation in disease severity within the first and second 14 days and illustrated the importance of evaluation over the full 28-day period.
An OS with well-defined, robust features, based on discrete EHR data elements, is useful for assessments of COVID-19 patient outcomes, providing insights on the progression of COVID-19 disease severity over time.
The OS provides a framework that can facilitate better understanding of the course of acute COVID-19, informing clinical decision-making and resource allocation.
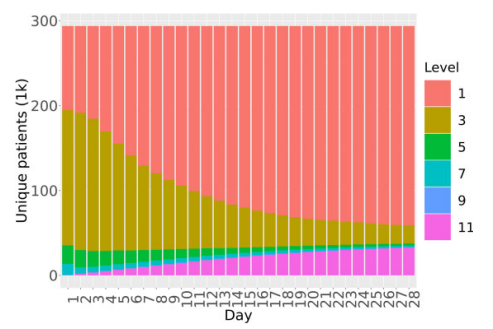
SARS-CoV-2 diagnosis.
OS Level 1: Outpatient, OS Level 3: Hospitalized, OS Level 5: Oxygen support,
OS Level 7: Mechanical ventilator, OS Level 9: Organ support, OS Level 11:
Death.
Anzalone AJ, Horswell R, Hendricks BM, Chu S, Hillegass WB, Beasley WH, Harper JR, Kimble W, Rosen CJ, Miele L, McClay JC, Santangelo SL, Hodder SL; National COVID Cohort Collaborative (N3C) Consortium. Higher hospitalization and mortality rates among SARS-CoV-2-infected persons in rural America. J Rural Health. 2022 Jun 27:10.1111/jrh.12689. doi: 10.1111/jrh.12689. Epub ahead of print. PMID: 35758856; PMCID: PMC9349606.
Purpose: Rural communities are among the most underserved and resource-scarce populations in the United States. However, there are limited data on COVID-19 outcomes in rural America. This study aims to compare hospitalization rates and inpatient mortality among SARS-CoV-2-infected persons stratified by residential rurality.
Methods: This retrospective cohort study from the National COVID Cohort Collaborative (N3C) assesses 1,033,229 patients from 44 US hospital systems diagnosed with SARS-CoV-2 infection between January 2020 and June 2021. Primary outcomes were hospitalization and all-cause inpatient mortality. Secondary outcomes were utilization of supplemental oxygen, invasive mechanical ventilation, vasopressor support, extracorporeal membrane oxygenation, and incidence of major adverse cardiovascular events or hospital readmission. The analytic approach estimates 90-day survival in hospitalized patients and associations between rurality, hospitalization, and inpatient adverse events while controlling for major risk factors using Kaplan-Meier survival estimates and mixed-effects logistic regression.
Findings: Of 1,033,229 diagnosed COVID-19 patients included, 186,882 required hospitalization. After adjusting for demographic differences and comorbidities, urban-adjacent and nonurban-adjacent rural dwellers with COVID-19 were more likely to be hospitalized (adjusted odds ratio [aOR] 1.18, 95% confidence interval [CI], 1.16-1.21 and aOR 1.29, CI 1.24-1.1.34) and to die or be transferred to hospice (aOR 1.36, CI 1.29-1.43 and 1.37, CI 1.26-1.50), respectively. All secondary outcomes were more likely among rural patients.
Conclusions: Hospitalization, inpatient mortality, and other adverse outcomes are higher among rural persons with COVID-19, even after adjusting for demographic differences and comorbidities. Further research is needed to understand the factors that drive health disparities in rural populations.
Price BS, Khodaverdi M, Halasz A, Hendricks B, Kimble W, et al. (2021) Predicting increases in COVID-19 incidence to identify locations for targeted testing in West Virginia: A machine learning enhanced approach. PLOS ONE 16(11): e0259538. https://doi.org/10.1371/journal.pone.0259538
During the COVID-19 pandemic, West Virginia developed an aggressive SARS-CoV-2 testing strategy which included utilizing pop-up mobile testing in locations anticipated to have
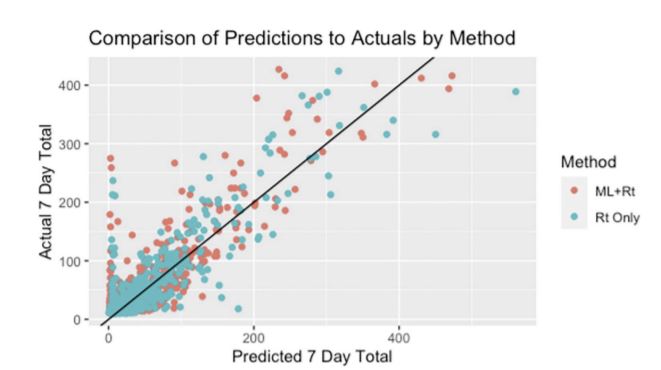
near-term increases in SARS-CoV-2 infections. This study describes and compares two methods for predicting near-term SARS-CoV-2 incidence in West Virginia counties. The first
method, Rt Only, is solely based on producing forecasts for each county using the daily instantaneous reproductive numbers, Rt. The second method, ML+Rt, is a machine learning
approach that uses a Long Short-Term Memory network to predict the near-term number of cases for each county using epidemiological statistics such as Rt, county population information, and time series trends including information on major holidays, as well as leveraging statewide COVID-19 trends across counties and county population size. Both approaches used daily county-level SARS-CoV-2 incidence data provided by the West Virginia Department Health and Human Resources beginning April 2020. The methods are compared on the accuracy of near term SARS-CoV-2 increases predictions by county over 17 weeks from January 1, 2021- April 30, 2021. Both methods performed well (correlation between forecasted number of cases and the actual number of cases week over week is 0.872 for the ML+Rt method and 0.867 for the Rt Only method) but differ in performance at various time points. Over the 17-week assessment period, the ML+Rt method outperforms the Rt Only method in identifying larger spikes. Results show that both methods perform adequately in both rural and non-rural predictions. Finally, a detailed discussion on practical issues regarding implementing forecasting models for public health action based on Rt is provided, and the potential for further development of machine learning methods that are enhanced by Rt.
Hendricks, B., Paul, R., Smith, C., Wen, S., Kimble, W., Amjad, A., ... & Hodder, S. (2021). Coronavirus testing disparities associated with community level deprivation, racial inequalities, and food insecurity in West Virginia. Annals of Epidemiology, 59, 44-49.
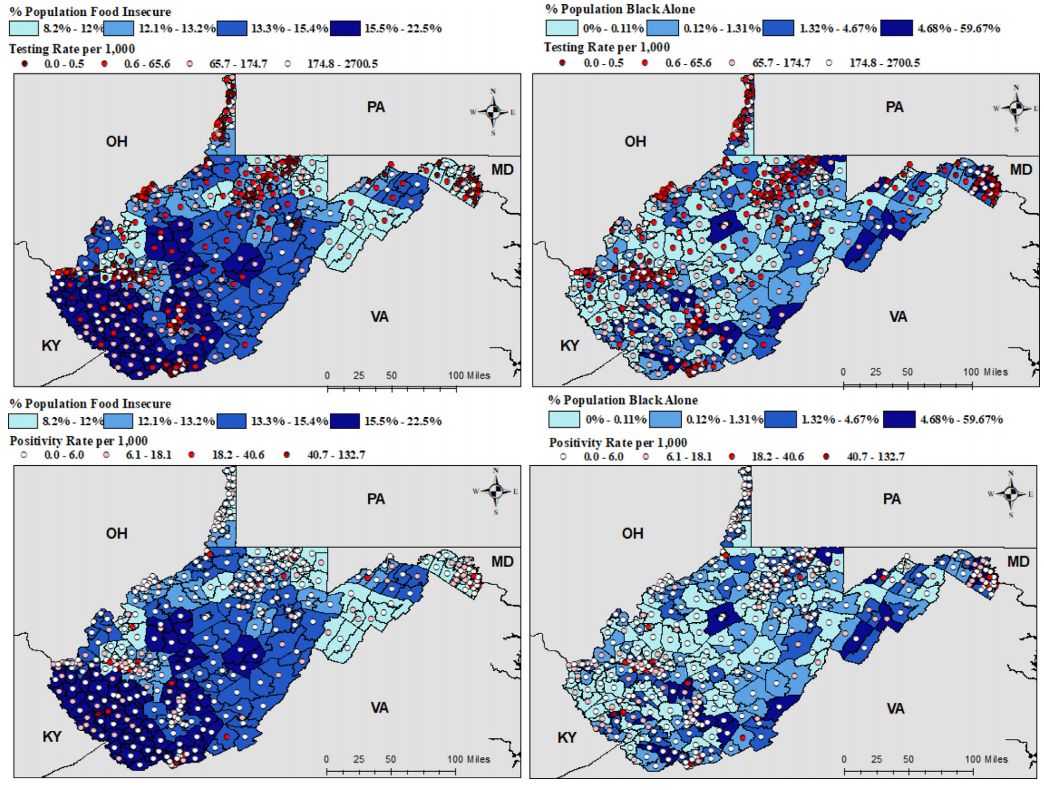
Purpose. Social determinants of health and racial inequalities impact healthcare access and subsequent coronavirus testing. Limited studies have described the impact of these inequities on rural minorities living in Appalachia. This study investigates factors affecting testing in rural communities.
Methods. PCR testing data were obtained for March through September 2020. Spatial regression analyses were fit at the census tract level. Model outcomes included testing and positivity rate. Covariates included rurality, percent Black population, food insecurity, and area deprivation index (a comprehensive indicator of socioeconomic status).
Results. Small clusters in coronavirus testing were detected sporadically, while test positivity clustered in mideastern and southwestern WV. In regression analyses, percent food insecurity (IRR = 3.69×10⁹, [796, 1.92×10¹⁶]), rurality (IRR=1.28, [1.12, 1.48]), and percent population Black (IRR = 0.88, [0.84, 0.94]) had substantial effects on coronavirus testing. However, only percent food insecurity (IRR = 5.98 × 10⁴, [3.59, 1.07×10⁹]) and percent Black population (IRR = 0.94, [0.90, 0.97]) displayed substantial effects on the test positivity rate.
Conclusions. Findings highlight disparities in coronavirus testing among communities with rural minorities. Limited testing in these communities may misrepresent coronavirus incidence.
Vaccine Preventable Disease Studies
Tressler, S. R., Smith, G. S., & Hendricks, B. M. (2020). Impact of a vaccine intervention on county-level rates of acute hepatitis B in West Virginia, 2011–2018. Preventive medicine, 137, 106121.
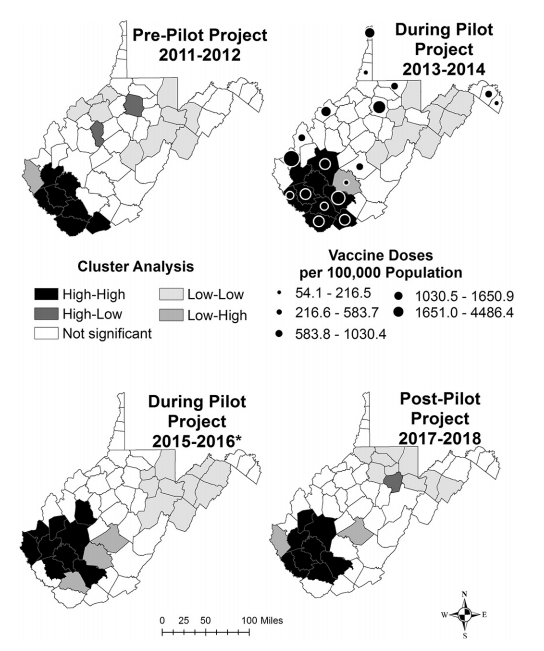
The rate of acute hepatitis B in West Virginia (WV) has been increasing since 2006. To reduce new infections, WV implemented a vaccine intervention (WV Pilot Project), which provided over 10,000 doses of hepatitis B vaccine to at-risk adults in 18 counties. The objectives of this study were to describe yearly changes in acute hepatitis B incidence and assess county-level impact of the WV Pilot Project using geospatial methods. County rates of acute hepatitis B and vaccine doses per 100,000 population were visualized biannually from 2011 to 2018. Local indicators of spatial autocorrelation were used to detect county-level clustering. Significant differences in the median rate of acute hepatitis B pre and post intervention in counties receiving vaccine were evaluated using Wilcoxon signed-rank test and bootstrapping. A Bland-Altman graph visualized significant differences in county-level rates of acute hepatitis B before and after the WV Pilot Project compared to the statewide estimate. Analyses identified significant geographic clustering of acute hepatitis B in southern WV across all four time-periods. Nine of the 18 (50%) counties receiving vaccine had significant declines in acute hepatitis B incidence compared to the statewide mean difference estimate. Findings suggest that increased dissemination of hepatitis B vaccine through local health departments and existing harm reduction services can reduce the incidence of acute hepatitis B in states such as WV, which have been disproportionately affected by substance misuse.
Vector-borne Disease Studies
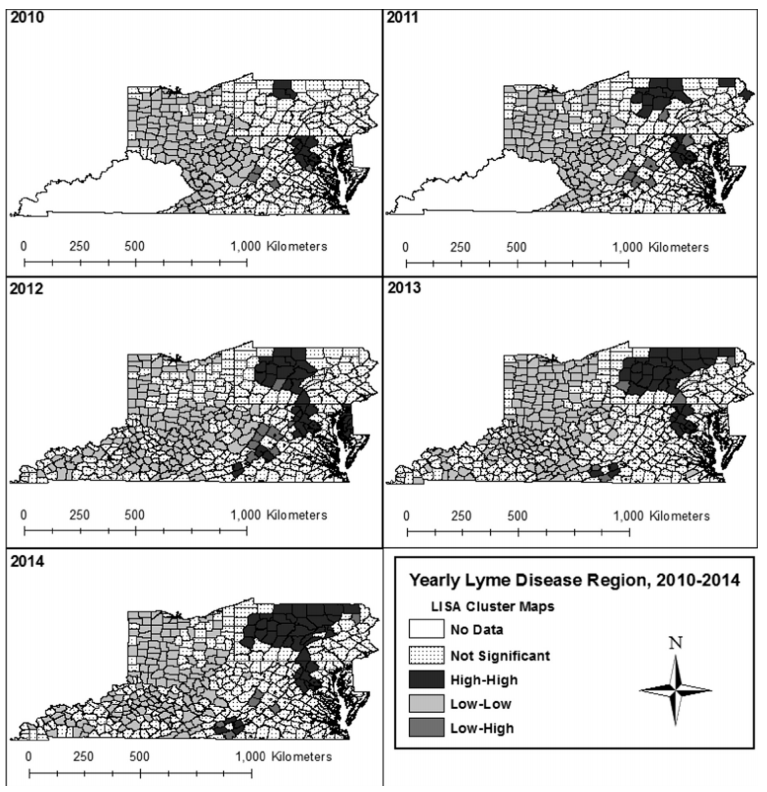
Hendricks, B., & Mark-Carew, M. (2017). Using exploratory data analysis to identify and predict patterns of human Lyme disease case clustering within a multistate region, 2010–2014. Spatial and spatio-temporal epidemiology, 20, 35-43.
Lyme disease is the most commonly reported vector borne disease in the United States. The objective of our study was to identify patterns of Lyme disease reporting after multistate inclusion to mitigate potential border effects. County-level human Lyme disease surveillance data were obtained from Kentucky, Maryland, Ohio, Pennsylvania, Virginia, and West Virginia state health departments. Rate smoothing and Local Moran's I was performed to identify clusters of reporting activity and identify spatial outliers. A logistic generalized estimating equation was performed to identify significant associations in disease clustering over time. Resulting analyses identified statistically significant (P = 0.05) clusters of high reporting activity and trends over time. High reporting activity aggregated near border counties in high incidence states, while low reporting aggregated near shared county borders in non-high incidence states. Findings highlight the need for exploratory surveillance approaches to describe the extent to which state level reporting affects accurate estimation of Lyme disease progression.
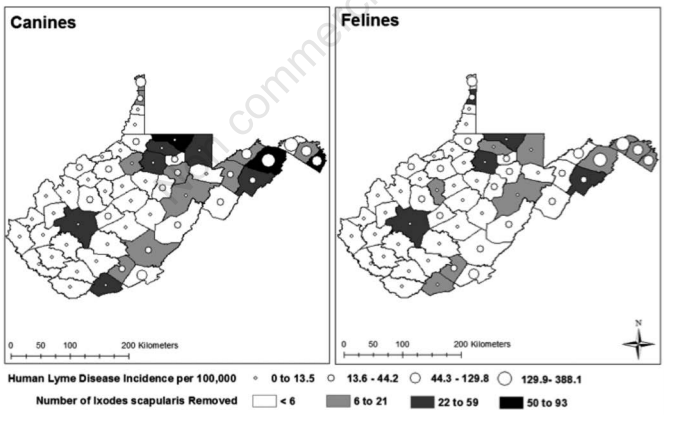
Hendricks, B., Mark-Carew, M., & Conley, J. (2017). Evaluating the utility of companion animal tick surveillance practices for monitoring spread and occurrence of human Lyme disease in West Virginia, 2014-2016. Geospatial health, 12(2).
Domestic dogs and cats are potentially effective sentinel populations for monitoring occurrence and spread of Lyme disease. Few studies have evaluated the public health utility of sentinel programmes using geo-analytic approaches. Confirmed Lyme disease cases diagnosed by physicians and ticks submitted by veterinarians to the West Virginia State Health Department were obtained for 2014-2016. Ticks were identified to species, and only Ixodes scapularis were incorporated in the analysis. Separate ordinary least squares (OLS) and spatial lag regression models were conducted to estimate the association between average numbers of Ix. scapularis collected on pets and human Lyme disease incidence. Regression residuals were visualised using Local Moran’s I as a diagnostic tool to identify spatial dependence. Statistically significant associations were identified between average numbers of Ix. scapularis collected from dogs and human Lyme disease in the OLS (β=20.7, P<0.001) and spatial lag (β=12.0, P=0.002) regression. No significant associations were identified for cats in either regression model. Statistically significant (P≤0.05) spatial dependence was identified in all regression models. Local Moran’s I maps produced for spatial lag regression residuals indicated a decrease in model over- and under-estimation, but identified a higher number of statistically significant outliers than OLS regression. Results support previous conclusions that dogs are effective sentinel populations for monitoring risk of human exposure to Lyme disease. Findings reinforce the utility of spatial analysis of surveillance data, and highlight West Virginia’s unique position within the eastern United States in regards to Lyme disease occurrence.